On demande souvent, dans l'industrie des toitures, si la version 2016 de la norme ASCE 7 augmentera la pression éolienne exercée sur le bâtiment. La réponse est oui dans de nombreux cas. La question suivante est donc : dans quelle mesure? Cela nous amène à la question suivante : à quel point la capacité des systèmes de toiture devra-t-elle être accrue afin qu'une conception tenant compte de la résistance au vent respecte la norme ASCE 7-16?
This blog looks at 2 buildings of different sizes and heights in two cities in the U.S., one centrally located and one along the Gulf coast, and compares design wind pressures based on ASCE 7-10 and ASCE 7-16. By assessing the required roof-system capacity for all roof zones in conjunction with the increases in the size of roof zones, we can begin to put some real numbers to the question "by how much will ASCE 7-16 affect the low-slope roofing industry?"
While analysis of two building types in two cities doesn't represent a significant study, this study offers an example of how the 2016 version of ASCE 7 is going to affect installed roofing systems over the next decade.
Études de cas
Design wind pressures (DWP) were determined for two building types in two cities. DWPs were based on varying the Risk Category and Exposure. The following table shows the building types, cities, variables, and constants.
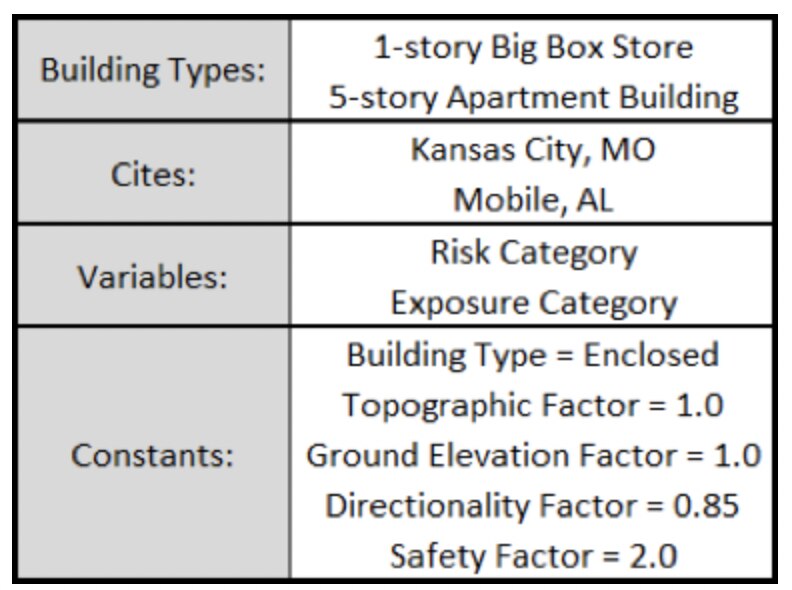
The big box store is 290' long x 169' wide x 24' tall, and the apartment building is 100' long x 40' wide x 55' tall. Wind speeds were determined using an online tool.
DWPs can be determined by using proprietary third party methods (e.g., RoofNav), simplified calculation tools (e.g., RoofWindDesigner), or hand calculations following the methods within the ASCE 7 standard.
For this case study, DWPs were determined using hand calculations via an Excel spreadsheet. The DWPs are slightly more refined since there was no rounding of wind speeds for ASCE 7-16. Both RoofNav and Roof Wind Designer round to the nearest 5 or 10 mph. The maps in ASCE 7-16 have been revised, not only from a wind speed perspective but from the number of wind isobars on the maps. The ASCE 7-16 maps are more refined which allows for more exact wind speed values.
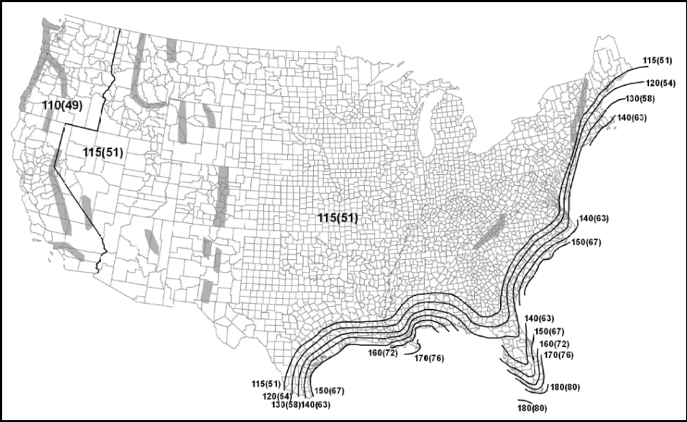
ASCE 7-10 Map, Risk Category II, showing a limited number of wind-speed isobars.
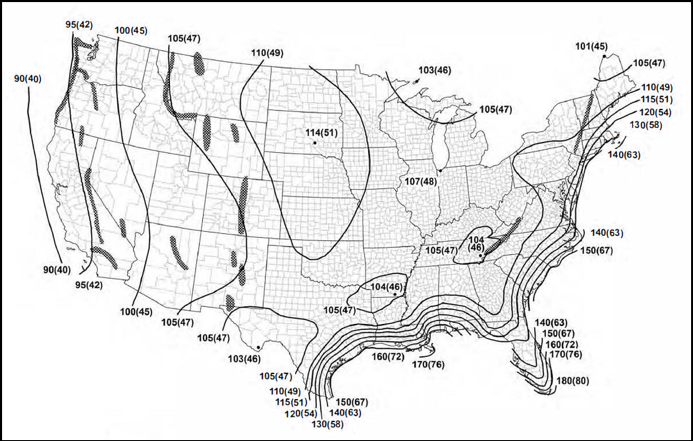
ASCE 7-16 Map, Risk Category II, showing many additional wind-speed isobars relative to the ASCE 7-10 wind map shown in the above figure.
In total, 72 different sets of DWPs were calculated. Buildings over 60' tall are designed the same in ASCE 7-16 as in ASCE 7-10; therefore, this article focuses on buildings less than 60' tall.
Design Wind Pressure Results
The following charts provide the DWPs for each of the scenarios that were analyzed for this article.
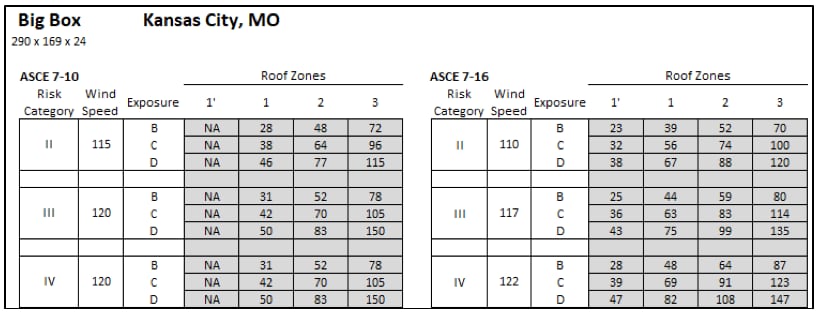
Design wind pressures based on ASCE 7-10 and ASCE 7-16 for a big box store in Kansas City, MO that is 24' tall.
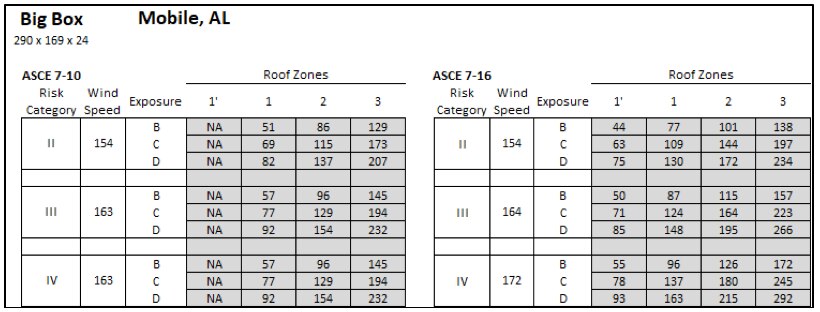
Design wind pressures based on ASCE 7-10 and ASCE 7-16 for a big box store in Mobile, AL that is 24' tall.
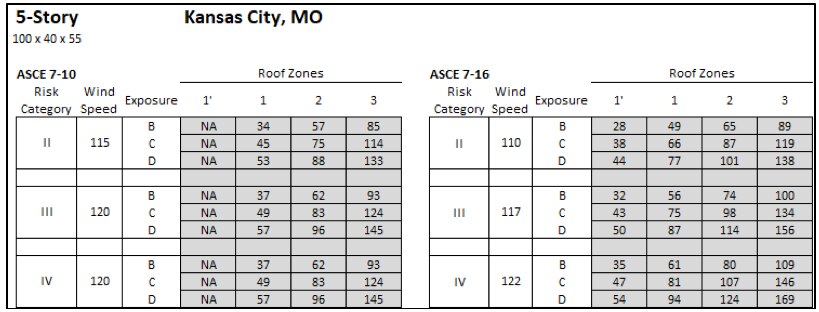
Design wind pressures based on ASCE 7-10 and ASCE 7-16 for a 5-story apartment building in Kansas City, MO that is 55' tall.
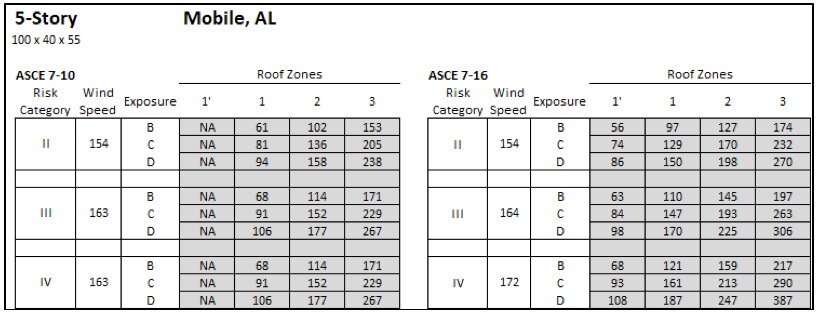
Design wind pressures based on ASCE 7-10 and ASCE 7-16 for a 5-story apartment building in Mobile, AL that is 55' tall.
Comparing the 2010 and 2016 versions
The primary intent of this article is to start generating data to help answer the question "how much did the DWP increase from the 2010 version to the 2016 version of ASCE 7?" Using the DWP calculated for each roof zone within each of the four scenarios, we calculated the percent increase in DWP per zone. The percent increases in DWP were calculated by dividing the ASCE 7-16 value with the corresponding ASCE 7-10 value for each roof zone. However, because there are 4 roof zones in ASCE 7-16 (and 3 roof zones in ASCE 7-10), both Roof Zones 1' and 1 were divided by the value for ASCE 7-10 Roof Zone 1 to determine the percent increase. Values in the following charts that are below 100 % (shaded gray) indicate a reduction in DWP from ASCE 7-10 to 7-16.
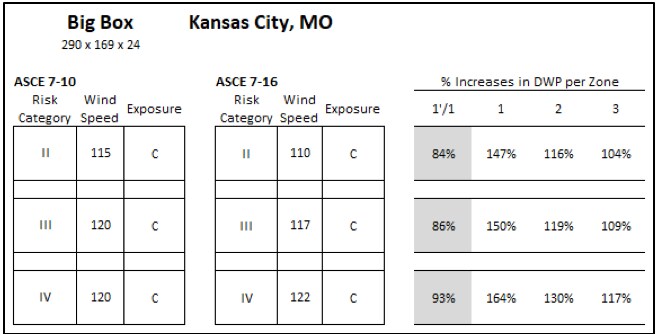
Percent increases in DWP per roof zone for a big box store in Kansas City, MO that is 24' tall, focusing on Exposure C values.
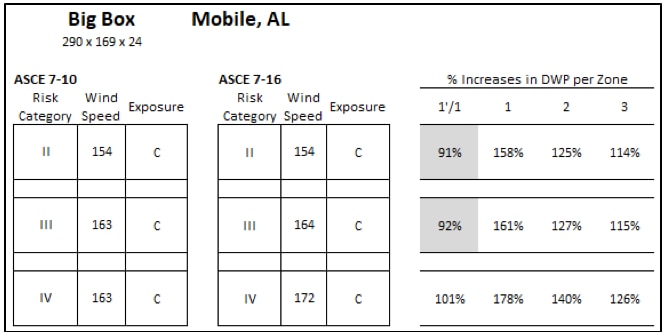
Percent increases in DWP per roof zone for a big box store in Mobile, AL that is 24' tall, focusing on Exposure C values.
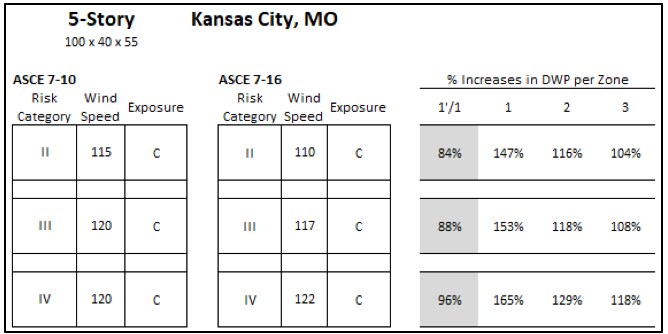
Percent increases in DWP per roof zone for a 5-story apartment building in Kansas City, MO that is 55' tall, focusing on Exposure C values.
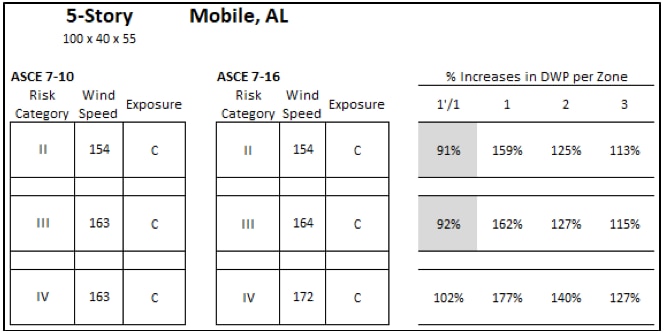
Percent increases in DWP per roof zone for a 5-story apartment building in Mobile, AL that is 55' tall, focusing on Exposure C values.
For the big box store scenarios, the percent increases in DWP per roof zone varies from 84 % to 178 %. The percent reductions (values less than 100 %) are all in Roof Zone 1' while Roof Zones 1, 2, and 3 have increased DWP. As seen in the Figures, Roof Zone 1 percent increases are greatest while Roof Zone 3 increases are smallest.
For the 5-story apartment building scenarios, the percent increases in DWP per roof zone varies from 84 % to 177 %. The percent increases in Roof Zone 1 are the largest. The percent reductions are all Roof Zone 1'.
It is worth noting that the increases in Pressure Coefficients from ASCE 7-10 to 7-16 are, in fact, relatively indicative of the increases in DWP. For more on Pressure Coefficients and the wind design process.
The case studies in this blog also show that the 2016 version of ASCE 7 imposes higher DWPs in Roof Zones 1, 2, and 3. However, given some of the substantial reductions in Roof Zone 1', it could be expected that installed roof system capacity may be lower. While that is hopeful, the roofing industry has a minimum-capacity backstop of 60 psf. This means that any calculated DWP at or below 60 psf (even for DWP values as low as 23 psf) will have a 60-psf-capacity roof assembly installed to meet building code requirements. The reality is many buildings are required to use a 60-psf-capacity roof system when in fact '60 psf' is more capacity than needed based on calculated DWPs.
Let's take a closer look at one subset for each of the 4 scenarios.
Example 1: Big Box; Central US
The big box store in KC, MO (Risk Category II, Exposure C) saw the DWP increase from 38 psf to 56 psf in Roof Zone 1 per ASCE 7-10 vs ASCE 7-16; and reduce to 32 psf in Roof Zone 1'. Regardless of the increases or decreases, a 60-psf-capacity roof should be installed in both Roof Zone 1 and Roof Zone 1' per 7-16, which is unchanged relative to ASCE 7-10.
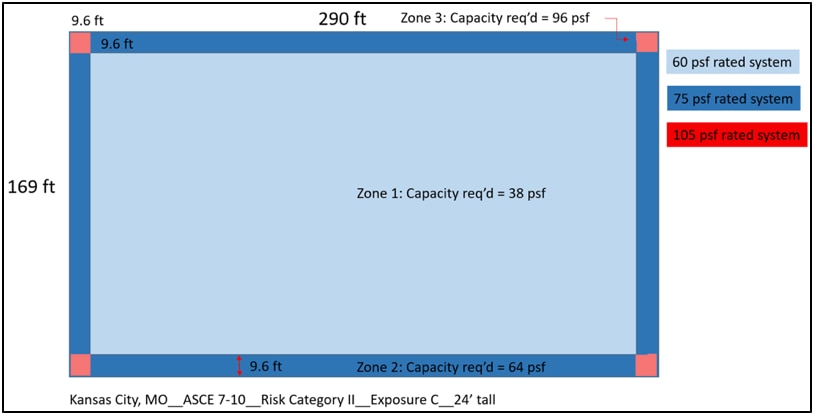
Roof zones and pressures for a 24' tall big box store in Kansas City, MO based on ASCE 7-10 using Risk Category II and Exposure C.
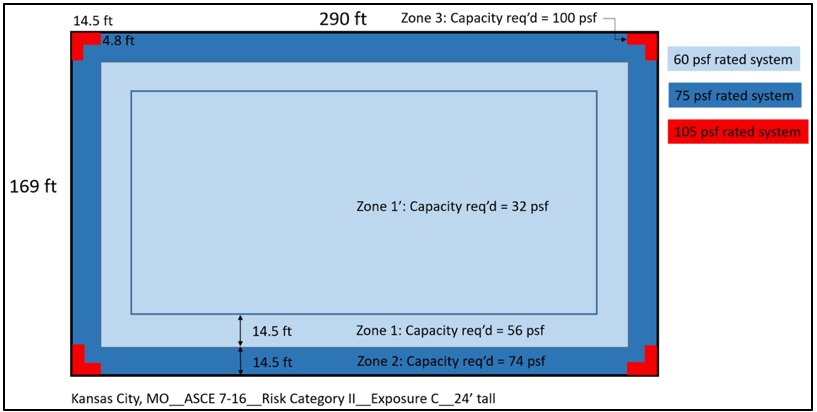
Roof zones and pressures for a 24' tall big box store in Kansas City, MO based on ASCE 7-16 using Risk Category II and Exposure C.
For Roof Zones 2 and 3, the DWPs are not only increased, but the sizes of the roof zones that require higher capacity are also increased. Roof Zone 2 per ASCE 7-10 required a 75-psf-capacity roof, and a 75-psf-capacity roof will be needed per ASCE 7-16. However, approximately 9 % of the roof area will need a higher capacity because of the increase in roof zone size. The following chart shows roof area percentages based on the required roof system capacity for this scenario.
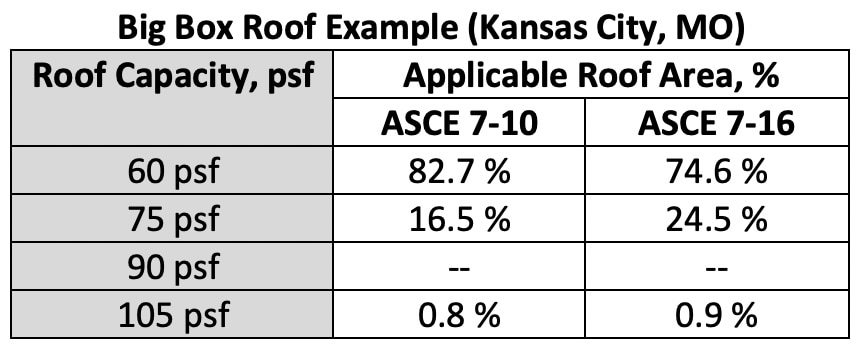
Chart showing required roof capacity and the roof area (%) where each is required.
Example 2: Big Box; Gulf Coast
A big box store in Mobile, AL (Risk Category II, Exposure C) saw the DWP increase from 69 psf to 109 psf in Roof Zone 1 per ASCE 7-10 vs ASCE 7-16; and reduce to 63 psf in Roof Zone 1'. A 75-psf-capacity roof should be installed in Roof Zone 1', and higher-capacity roofs will be required in Roof Zones 1, 2, and 3 relative to ASCE 7-10.
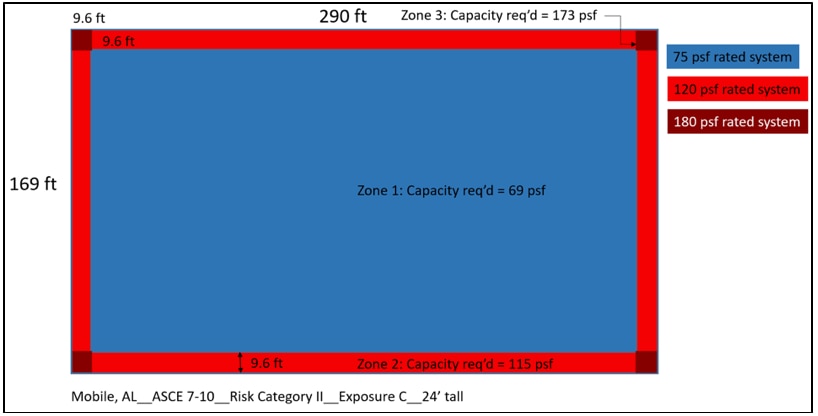
Roof zones and pressures for a 24' tall big box store in Mobile, AL based on ASCE 7-10 using Risk Category II and Exposure C.
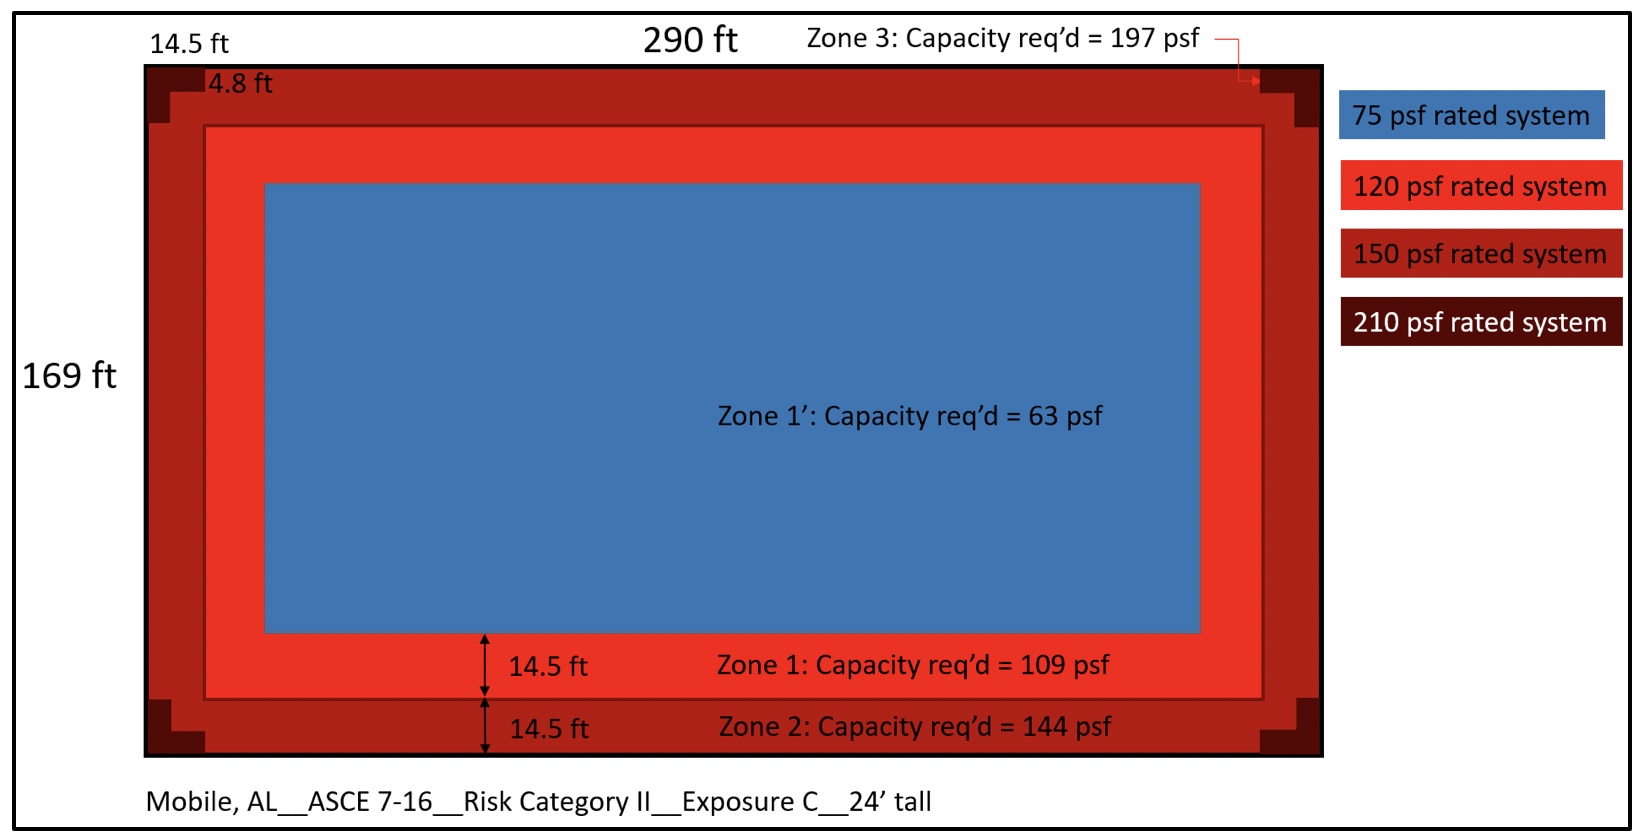
Roof zones and pressures for a 24' tall big box store in Mobile, AL based on ASCE 7-16 using Risk Category II and Exposure C.
For Roof Zones 1, 2, and 3, the DWPs are not only increased, but the size of the roof zones that require higher capacity are also increased. A larger perimeter roof zone (combining Roof Zones 1 and 2) with higher required capacity is created (relative to 7-10). Approximately 30+% of the roof area will need a higher capacity. The following chart shows roof area percentages based on the required roof system capacity for this scenario.
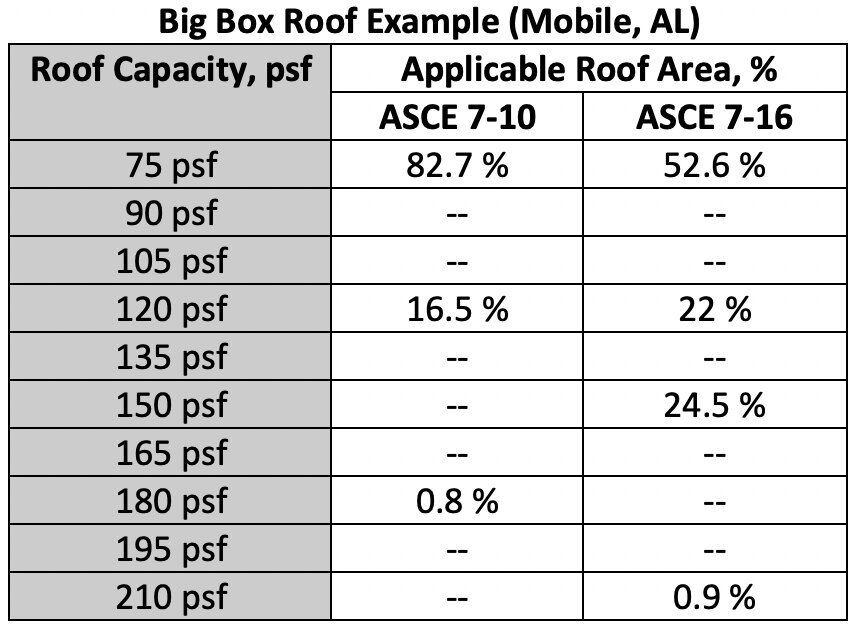
Chart showing required roof capacity and the roof area (%) where each is required.
Example 3: 5-story; Central US
The 5-story apartment building in KC, MO (Risk Category II, Exposure C) saw the DWP increase from 45 psf to 66 psf in Roof Zone 1 per ASCE 7-10 vs ASCE 7-16; and reduce to 38 psf in Roof Zone 1'.
However, because the method used to determine the sizes of roof zones in ASCE 7-16 is changed, Roof Zones 1' and 1 do not exist on this building! Decreases of DWP in Roof Zone 1' are rendered meaningless, and the lack of a Roof Zones 1' and 1 means the entire roof consists of only Roof Zones 2 and 3, the perimeter and corner roof zones.
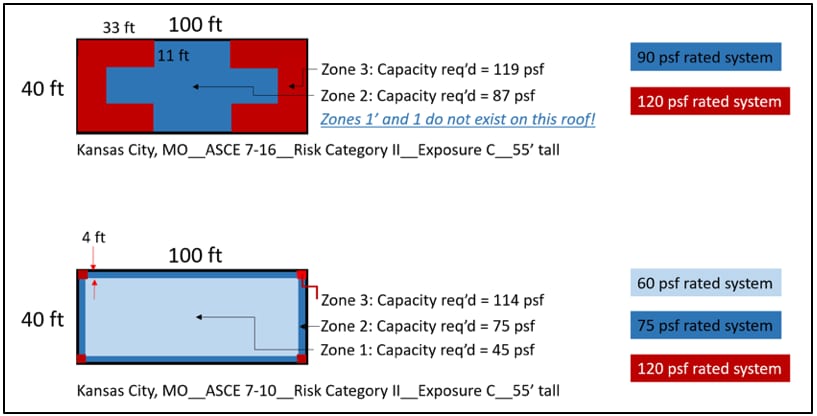
Roof zones and pressures for a 55' tall apartment building in Kansas City, MO based on ASCE 7-16 (top) and ASCE 7-10 (bottom) using Risk Cat II and Exposure C.
The increases in DWPs for the roof zones significantly increase the roof system capacity requirements for this scenario. Almost the entire roof area will need a higher capacity roof. The following chart shows roof area percentages based on the required roof system capacity for this scenario.
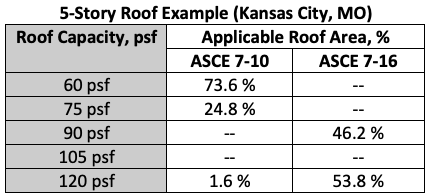
Chart showing required roof capacity and the roof area (%) where each is required.
Example 4: 5-story; Gulf Coast
The 5-story apartment building in Mobile, AL (Risk Category II, Exposure C) saw the DWP increase from 81 psf to 129 psf in Roof Zone 1 per ASCE 7-10 vs ASCE 7-16; and reduce to 74 psf in Roof Zone 1'. Similar to Example 3, due to the size of the roof zones relative to the size of the roof, Roof Zones 1' and 1 do not exist in this scenario.
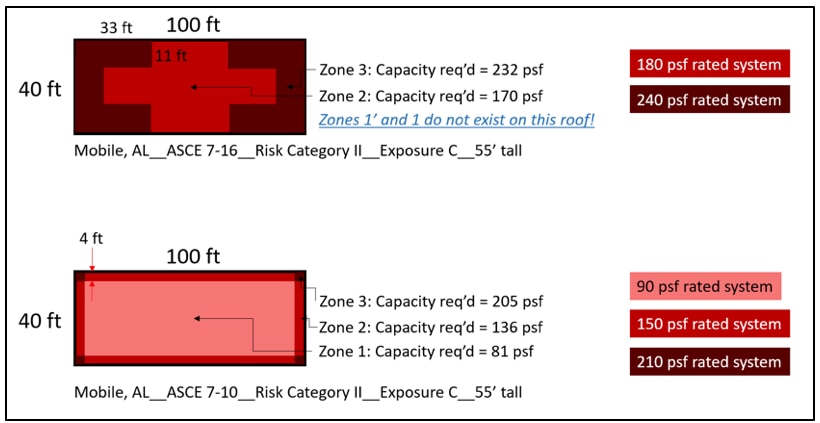
Roof zones and pressures for a 55' tall apartment building in Mobile, AL based on ASCE 7-16 (top) and ASCE 7-10 (bottom) using Risk Cat II and Exposure C.
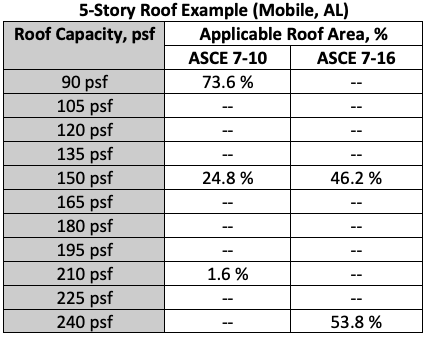
The increases in DWP for the roof zones significantly increase the roof system capacity requirements for this scenario. The entire roof area will need a higher capacity. The following chart shows roof area percentages based on the required roof system capacity for this scenario.
Performance versus Prescriptive
The case studies in this analysis are presented using a performance method for wind design. That is, a specific DWP is determined for each roof zone and a roof system with appropriate capacity is selected for use in the associated roof zone. Another method that is often used in the roofing industry is a prescriptive method for wind design. The DWP for Roof Zone 1 (or Roof Zone 1' in certain localities) is used to select a roof system with an appropriate capacity for Roof Zone 1 (similar to a performance method), and then Roof Zones 2 and 3 use an installation method/layout that is prescriptively increased relative to Roof Zone 1 installation methods. Prescriptive installation methods for Roof Zones 2 and 3 are regularly used with mechanically attached (MA) roof systems, and for MA roofs, Roof Zone 2 increases are commonly 50 % and Roof Zone 3 increases are commonly 100 %.
Conclusion
ASCE 7-16 DWPs are generally increasing relative to ASCE 7-10, but this impact is better understood by comparing the required roof system capacity for different building types and dimensions in different cities. Looking only at DWPs does not provide enough information; a comparison of required roof system capacities is needed. Not only did the DWPs change, but the methodology for determining the size of the perimeter and corner roof zones changed significantly in the new ASCE 7-16 version; the amount of roof area contained by the perimeter and corner roof zones increased. The case studies-of two buildings less than 60 ft tall in two cities-and corresponding analysis in this blog are just one additional small step to understanding how the ASCE 7-16 will affect wind design over the next decade.

